Close


After a long time, prosperity has returned to the Iranian stock market. But we must tell you that ordinary people do not do their shopping at this time.
Because they are either engaged in analyzing the index of the whole stock market. Or they think that because the dollar and coins have hit a new ceiling, it is better to buy coins. But I am telling you that according to the data of the market leaders, the best thing to do is to make your purchases at the same time as the leaders. We will provide you with an analysis of the total index and we will examine the industries.
Therefore, keep in mind that the market is kind to you when you use the right advisor. We are going to help you as your trusted advisors. One of the goals of the VIP digital currency site is to spread the investment culture. It doesn’t matter if your intention is to invest in digital currency or to buy and sell the total index of Tehran Stock Exchange. Stay with us on this path, if you find any stupid or incomprehensible points, be sure to ask us in the comments section.
What points should we pay attention to for the technical and fundamental analysis of the total index of Iran Stock Exchange?
Note that the Iranian stock market is an extremely important and volatile market. You can get the best feedback from the Iranian stock market when you can analyze the important economic indicators of the Iranian stock market. For example, one of the most important fundamental indicators, which is very important not only in Iran but in all directions. Bank interest rate. If you can understand the interest rate, I promise you the best profits in the market will be yours.
The second important indicator that you should pay attention to is the rate of inflation. When inflation increases in a country like Iran, the Tehran Stock Exchange index collects its spring and suddenly drops. You might think that inflation simply shows itself in the stock market. We must tell you that inflation does not show itself in such simple ways, but at an appropriate time, the stock market trigger is eaten and the stocks fly. Of course, keep in mind that the market always has signs.
Technical analyst and financial market researcher Amir Shadan has been used to analyze the total index. And all the value and credibility of this article belongs to the VIP digital currency market. You can use the Rahvard 365 site for technical analysis of the total index. Before buying and selling any stock, keep in mind that the most important pillar of financial markets is risk management. If you cannot control your risk. You will have no future in the market.
Note that we have used Price Action and order flow in RTM style for our overall indicator analysis. If any of the sections were dumb or incomprehensible to you, you can ask us. Gann style and Fibo-Ichi data have also been used to check time zones. But in order to simplify and understand the tradition of the market, we have tried to leave only a few important points for you. The chart has deleted sections, the results of which will be announced to you.
If you take a look at the chart above, you’ll notice that we’ve experienced a very steep correction in the image above. At the end of this correction, the market has hit a strong limit fleck, which is marked by a blue box. Our most important orders have been in this part of the market. On the other hand, we reach an important Fibonacci number on this section, which shows the accuracy of our data and flag. When the market makes a very deep correction, it needs to build a solid base in order to grow.
Our base was built from 10/30/1399 to 03/01/1400. Based on the sentiment of the market and on the other hand based on the behavior of the rising wave, it can be concluded that the market pivot has been identified. But you should also pay attention to the points that we will tell you later. On October 7, 1400, the correction process ended and the new market trend started.
Is the period of stagnation in the Iranian stock market over? To answer this question, it is better to take a look at the image above. On May 27, 1401, the trend of the Iranian stock market has increased. When the yellow line was broken and penetrated inside it, it meant that the Iranian stock market had started a new trend. The reason is also clear. When the market started moving new. Inside a limited CP penetrated the important LQ but I have to tell you that this was not the whole story. This CP area activated important orders when it was breached.
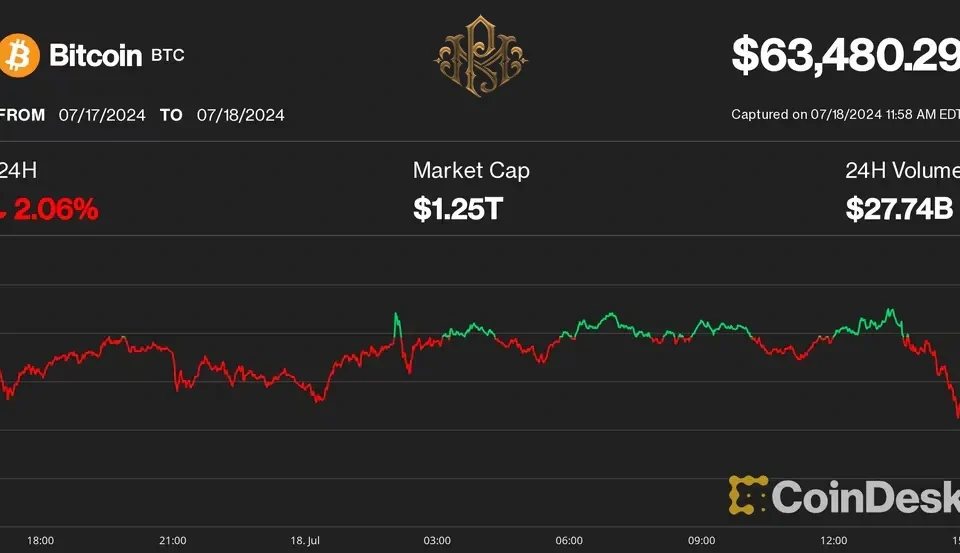
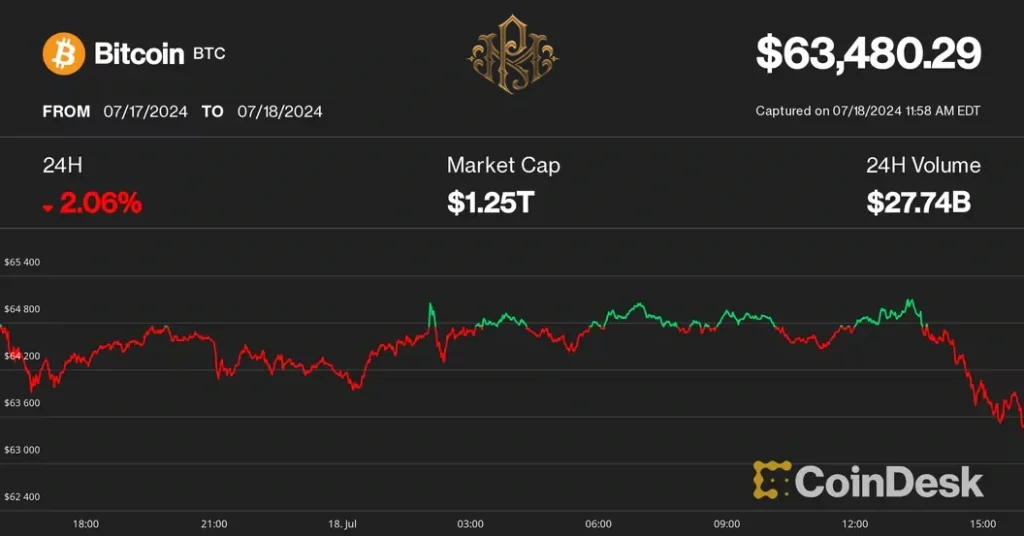
These embassies were mostly active in the secondary market of the Iranian stock exchange. This means that the bottom of the Iranian stock market has been closed in 1401. On the other hand, when we write this article for you. The dollar has reached a new ceiling. On the other hand, coins and melted gold are all being traded in oversold condition. As a result, the best market right now is the Iranian stock market.
Analysis of the path ahead of the Iranian stock market in the winter of 1401 and the spring and summer of 1402
Look at the above image again, you see a blue hazard in the above image to continue the path. This line is provided that the dollar is traded within the limit of 40 to 47 thousand tomans. It will be true for you. Note that the market will need a correction to remove the traders. Of course, a very important point is that it is always a move before we start a new trend
But the black line will work for you when we see a correction in the currency market and also in the gold market. Of course, keep in mind that our purpose in describing these two markets is for you to have a better understanding of society’s inflationary expectations. If the market corrects, the best place to buy is the middle blue limit.
In this article, we talked about the Iranian stock market and stock conditions in general. We examined two optimistic and pessimistic scenarios. But there may also be a critical situation, and that is the domestic and international political conditions, in which case the best buying limit is the cream-colored range that you have set the stop loss of the big real ones in the market. You can use this range as a market exit range and review your portfolio completely.

