Close


What is doji candlestick and how to trade with it? As you know, digital currency market analysis has grown a lot with the help of candlestick patterns. The Doji candlestick pattern is one of the patterns that helps traders a lot. You can learn more about the most important concepts in the field of this crypto model in the continuation of this article from Pooyan Music site.
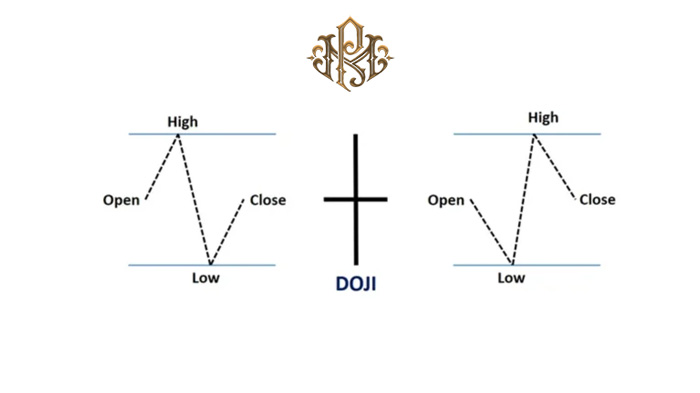
Doji candlestick pattern is a price pattern in technical analysis that can be seen in candlestick charts. This pattern occurs when the open and close prices of the candlestick are in the same vicinity, so that the body of the candlestick is between the upper and lower shadows. In fact, the Doji candlestick pattern indicates uncertainty in the market and may indicate a change in price direction.
Doji candlestick pattern can have two types: Doji up and Doji down. In the above doji pattern, the open and close price of the candlestick are close to each other, and the upper shadows of the candlestick are more than the lower ones. This pattern may indicate the transfer of power from buyers to sellers and indicate a change in the downward direction of the price.
But in the lower doji pattern, the open and close prices of the candle are close to each other and the lower shadows of the candle are more than the upper shadows. This pattern may indicate the transfer of power from sellers to buyers and indicate a change in the upward direction of the price. However, the Doji candlestick pattern is only a hint, and to make investment decisions, you need to do a more detailed analysis and use other analytical tools such as indicators and technical indicators.
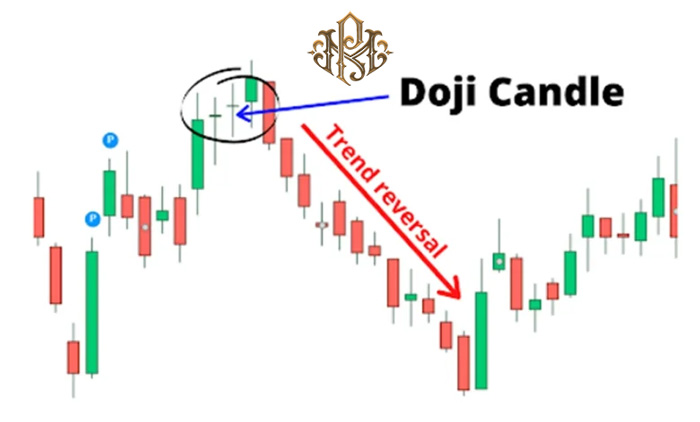
The Doji candlestick pattern shows that the market is in uncertainty and the forces of buyers and sellers are roughly balanced. This issue can mean a change in price direction or adjustment in price movement. A doji candlestick pattern may indicate a change in price direction.
In the upper doji pattern, where the upper shadows of the candlestick are more than the lower shadows, the power may shift from buyers to sellers and the price will change to the downside. In a lower doji pattern, where the lower shadows of the candlestick are more than the upper shadows, the power may shift from sellers to buyers and the price may change to the upside.
The doji candlestick pattern is relatively simple and recognizable. By studying candlestick patterns on price charts, you can easily identify and analyze a doji pattern. The Doji candlestick pattern can be used as an early indication to predict a change in price direction.
By combining the Doji pattern with other analytical tools such as trend lines, technical indicators, and support and resistance levels, you can make more accurate analysis and make better investment decisions. However, it should be noted that the Doji candlestick pattern is only a guide and should not be used alone to make decisions.
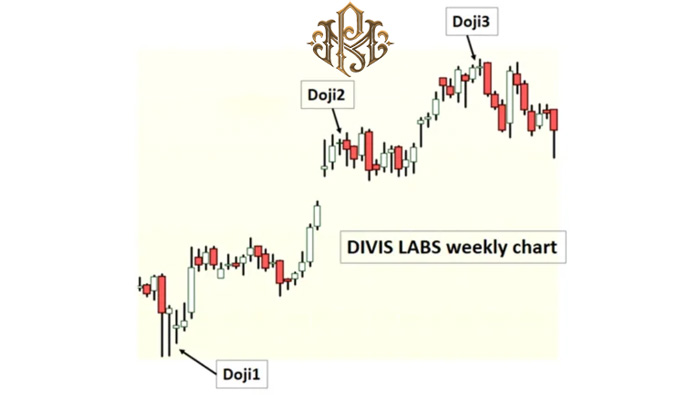
To begin with, you need to identify the doji candlestick pattern on the price chart. The doji candlestick pattern consists of a candlestick with a small body and long shadows on both sides of the body. A doji candle can be a high doji or a low doji. After identifying the doji candlestick pattern, you need to confirm it.
Examining the price chart and other patterns such as trend lines, support and resistance levels, and technical indicators can help you confirm the validity of the Doji candlestick pattern. After confirming the doji candlestick pattern, you can perform price direction analysis.
In the above doji pattern, if the price moves down and breaks the support level, the price may turn to the downside. In the lower doji pattern, if the price moves higher and breaks the resistance level, the price may change to the upside.
The Doji candlestick pattern is only a hint and you should not act on it alone to make a decision. Using other analytical tools such as trend lines, technical indicators and support and resistance levels can help you in more accurate and better analysis. You should always pay attention to risk management and use a suitable system for profit and loss management.
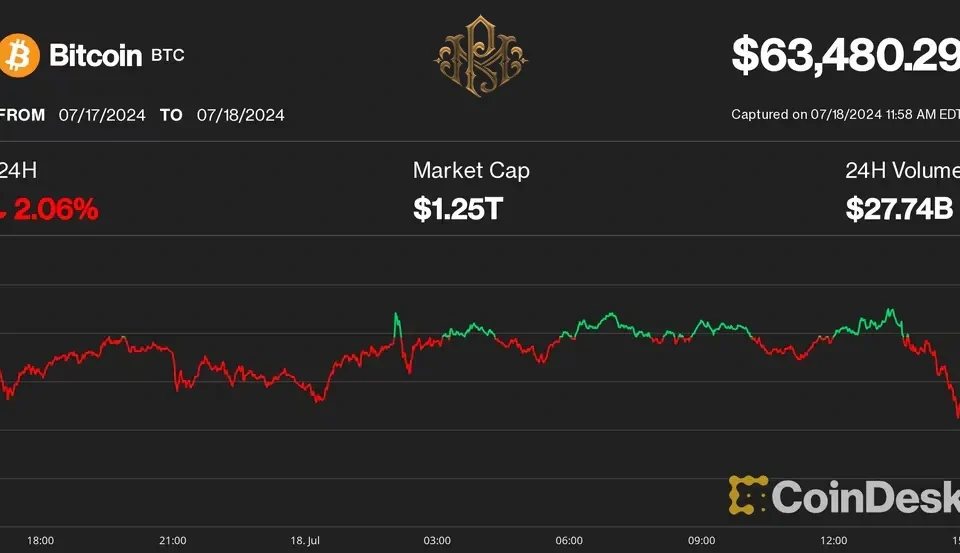
The Doji candlestick pattern is also used in digital currency analysis. In fact, doji candlestick pattern analysis is one of the methods used in digital currency technical analysis.
First, you need to identify the doji candlestick pattern on the price chart. After identifying the doji candlestick pattern, you need to confirm it. After confirming the doji candlestick pattern, you can perform price direction analysis.

