Close

Ripple (XRP) sees an unexpected price swing. But what is the reason for this sudden price correction of Ripple (XRP)? In this cryptocurrency post, we will examine the price of this trend reversal. Stay with “Pooyan Music“.
Ripple (XRP) has seen a significant change in its price trajectory. This represents a bullish move that market analysts had not widely anticipated. After a long period of stabilization, XRP price action has taken a decisive upward swing. The price of the token has crossed several key resistance levels, which points to the potential for continued upside.
Analyzing the latest price action, XRP successfully broke the $0.65 resistance level. A pivot point that used to act as a strong barrier to upward moves. Notable due to past price interactions, this level has turned from resistance to support. The level is now potentially setting the stage for further gains. XRP price action around this zone indicated strong buying interest. This is likely due to positive sentiment in the investor community and broader market cues.
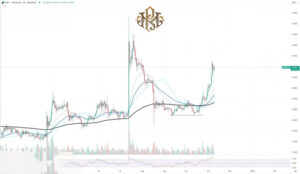
The next significant resistance level is at $0.75. Historically, this level has been a point of contention where the price of XRP has seen sell-offs and declines. The ability of XRP price to test and possibly break this level will be a critical determinant of the cryptocurrency’s short-term trajectory. A convincing move above this price could solidify the bullish trend and pave the way for a test of higher resistance levels.
Looking at the Relative Strength Index (RSI), a widely used momentum indicator, recent price movements have seen the RSI hover around the 70 mark. A level that traditionally indicates that an asset is now overbought. However, in the context of strong bullish sentiment, the RSI near this range could continue as the price continues to rise.
If XRP’s price action remains above the aforementioned resistance levels, it could boost investor confidence in the asset’s prospects for recovery and growth. However, the market should remain cautious. Because the implications of RSI on the possibility of overextension of the market can be destructive.

